A Simple Room Air Quality Visualizer Using Raspberry Pi and Golang
I usually try to find time creating something other than my products in order to learn new technologies that I’m interested in.
I usually try to find time creating something other than my products in order to learn new technologies that I’m interested in.
What is the Best Room Condition for Me?
Productivity deeply depends on air qualities. Some people would get headache when air pressure is low. Some people are not able to concentrate on their work while humidity is very high because of their sweat.
I wanted to see day-to-day quality of my room such as temperature, humidity and pressure so I can get better productivity by understanding how each air barometer causes and improves me.
First of all, I’m going to record data and visualize them with simple charts. I hope this article would be helpful for those who are trying to do the same thing!
Device & Sensors
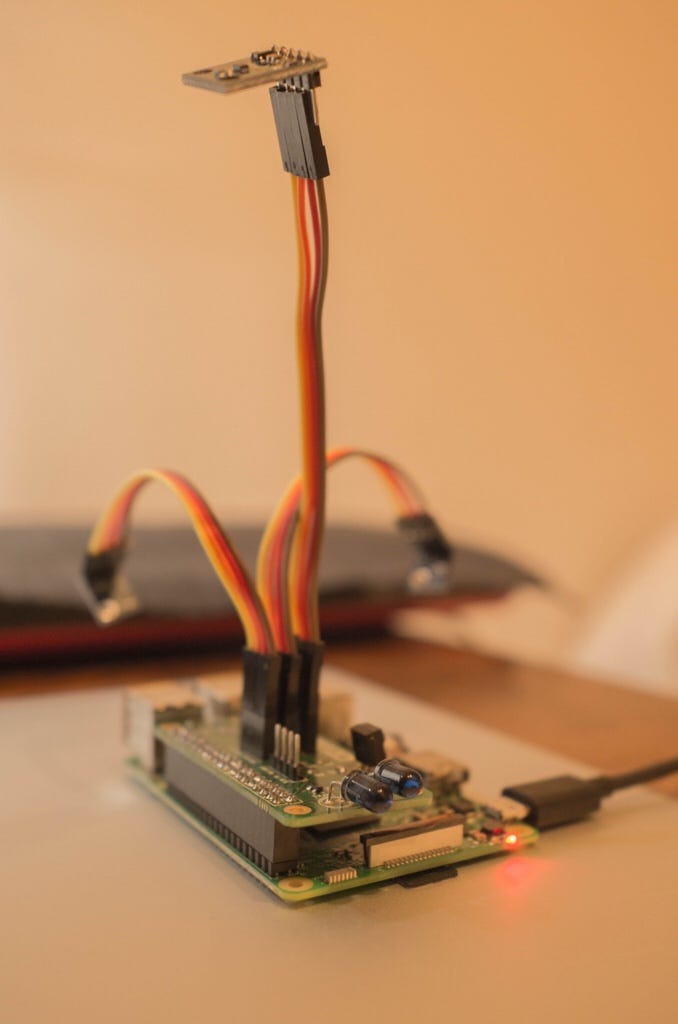
- Raspberry Pi 3
- ANAVI Infrared pHAT Advanced Kit
It comes with following sensors: temperature & humidity, barometric pressure, and light.
Also I am planning to add a CO2 sensor bought on AliExpress.
Retrieve the Sensor Data via Golang and Store Them to Cloud Firestore
I am interested in Golang and was looking for a practical example to use it because it’d be much helpful to understand the language than just completing tutorials.
Cloud Firestore is also very fascinating database service by Google, which is capable to sync in offline like PouchDB. It supports Composite Indexing and sort of complicated queries. It’s currently in beta yet but looks enough well-developed and documented.
I would like to be a friend of those two technologies through this side project.
Retrieve the Sensor Data
ANAVI is publishing a lot of examples on GitHub. You will get commands that output the sensor data after building them. You can parse the output string with Golang to extract data. Here is a code that extracts a temperature and pressure value from BMP180:
Store Data to Firestore
Now, let’s create a main script that stores the sensor data to Firestore:
Then, I configured cron to run it every 3 minutes. Let’s check it out if it correctly records the data from Firebase console:
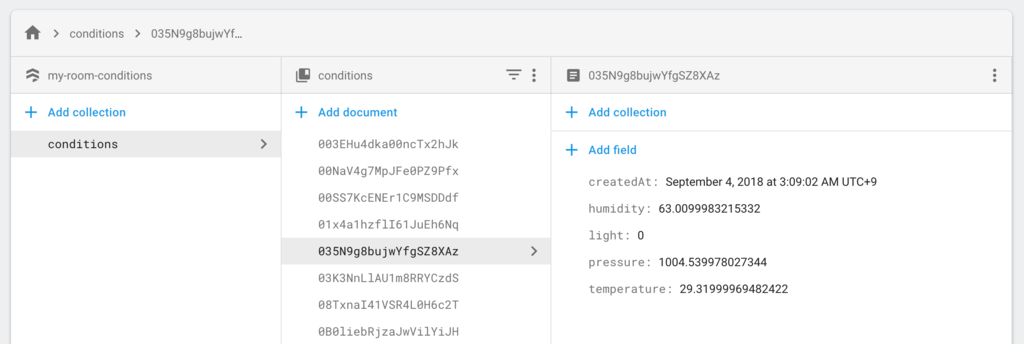
Good!
Web Interface For Charts
It’s sufficient that it runs on Chrome for mobile and desktop for me. It’s way easy to write arrow functions because of the recent Chrome improvements. I decided to write Vanilla JS because it’s going to be a very simple program ;)
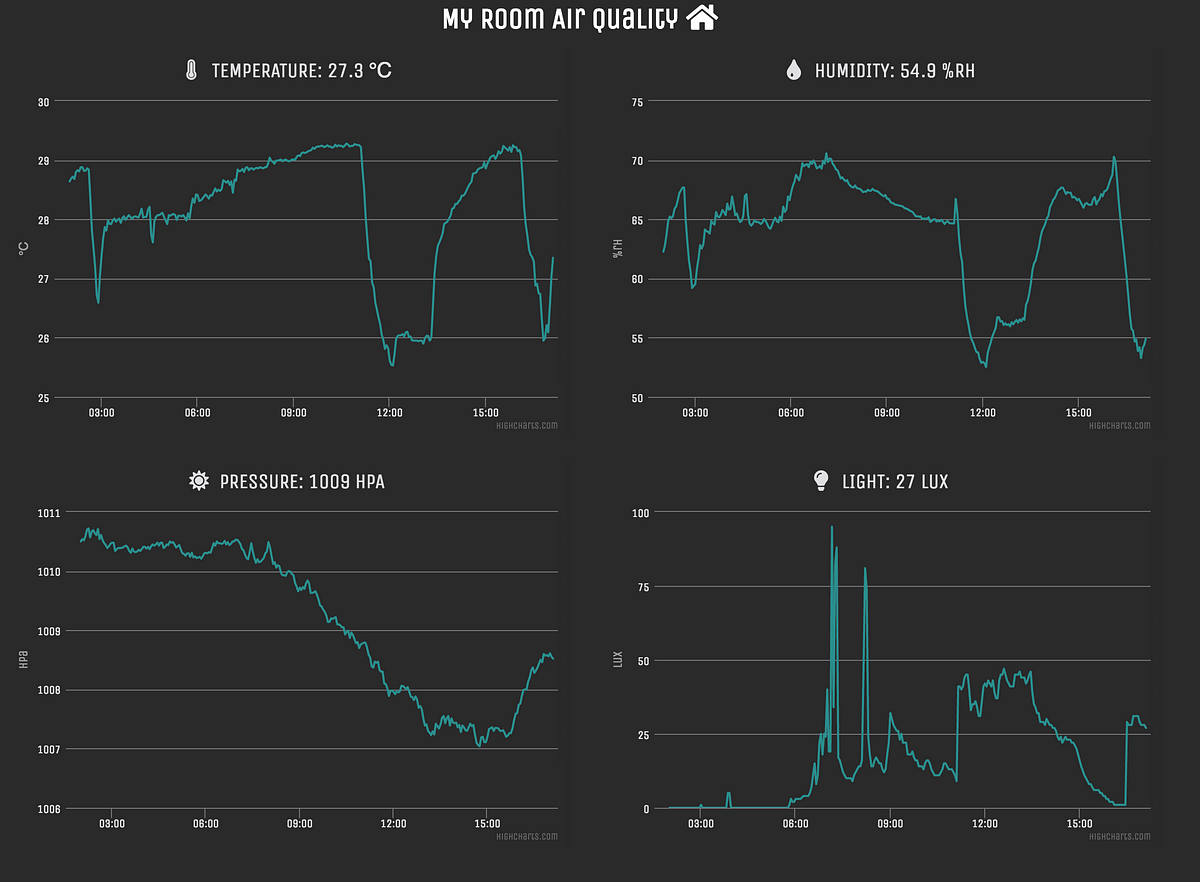
Here is the end result:
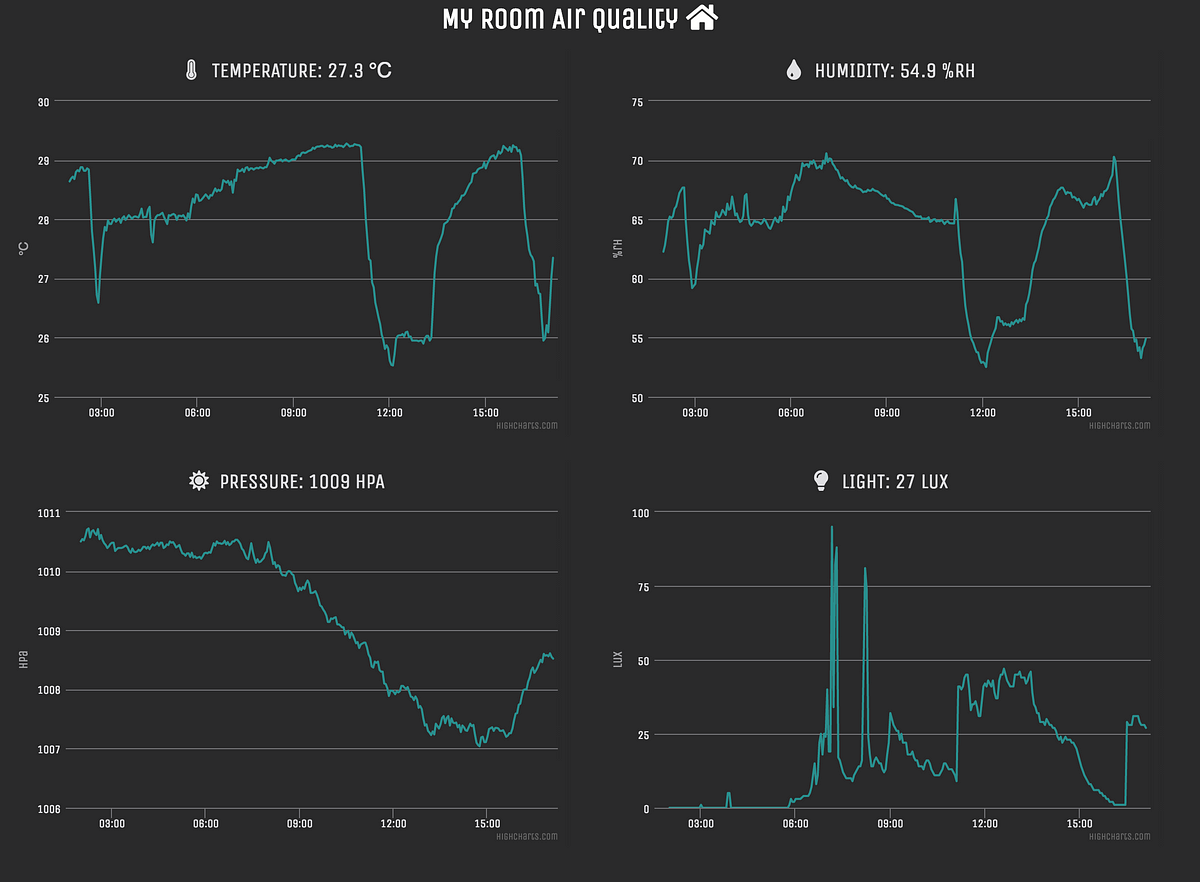
Cool, huh?
I used highcharts.js for drawing charts, which is also used by Mixpanel. I like it because it allows you to draw high quality diagrams with ease. It’s free if non-commercial use.
The source code looks like:
HTML:
JS:
I deployed it on Netlify.
Future Work
I’d like to add some features based on the recorded data:
- Show daily min, max and avg. values
- Record whether my performance was good or not
- Alerts (e.g., notify me when an air pressure is significantly low)
That’s it and very fun! Hope you enjoyed it :D
Follow me on Twitter if you like


